acquisition of Airbus A330-300 for Finnair
Finance
Master's thesis Mikko Allonen 2013
Department of Finance Aalto University
School of Business
Powered by TCPDF (www.tcpdf.org)
Abstract of master’s thesis
i Author Mikko Allonen
Title of thesis Operating lease or purchase – analysis, Case: An acquisition of Airbus A330-300 for Finnair
Degree Master of Economics Degree programme Finance Thesis advisor(s) Matti Suominen
Year of approval 2013 Number of pages 110 Language English
Abstract
Objectives of the study
The purpose of this thesis is to present different lease valuation techniques from the existing lit- erature that can be used when assessing a financing decision of an aircraft and then test these methods in practice with the actual data provided by Finnair. The case framework used is an ac- quisition of a new Airbus A330-300 widebody airliner. The main question is should the aircraft be purchased or leased under an operating lease. This leads to actual hypotheses which question whether operating lease is more cost-effective than purchasing in less than 10 year period or in the long run. Eventually the analysis provides a financing decision model for Finnair.
Research method and data
The research method of this thesis is a single-company case study. My analysis will be based on cash flow-based valuation techniques such as Net Present Value (NPV) and its more advanced de- rivative adjusted present value (APV). The results of the model are examined with a sensitivity analysis and further enhanced with a risk analysis tool utilizing Monte Carlo simulation. There a thousand simulations are made to find the deviation of present values. The data includes current and estimated market values and lease rates of A330-300 provided by an independent valuation company.
Findings of the study
My first hypothesis, “operating lease is more cost-effective than purchasing in less than 10 years' time”, was clearly accepted as the results from both NPV and APV were indisputable. The second hypothesis, that the above holds also if the time period is extended, remains unanswered or can even be rejected. Although APV still very strongly suggests leasing over purchasing, NPV starts to draw nearer to purchasing. Still statistically leasing is the preferable choice but it is apparent that when the time period is lengthened, the purchase becomes more tempting. As a conclusion, ac- cording to my analysis in current market environment Finnair should lease the A330 under an operating lease agreement rather than buy it. This is true especially if the considered utilisation of the aircraft is rather short.
Keywords Leasing, Operating lease, Financing decision, Cash-flow based valuation, Net present value, Adjusted present value, Monte Carlo simulation, Aircraft, Finnair, Airbus, Aviation, Airlines
Abstract of master’s thesis
ii Tekijä Mikko Allonen
Työn nimi Operatiivinen leasing vai osto – analyysi, Case: Uuden Airbus A330-300 hankinta Finnairille
Tutkinto Kauppatieteiden maisteri Koulutusohjelma Rahoitus
Työn ohjaaja(t) Matti Suominen
Hyväksymisvuosi 2013 Sivumäärä 110 Kieli Englanti
Tiivistelmä
Tutkimuksen tavoitteet
Tutkimuksen tavoitteena on nykyisestä kirjallisuudesta esitellä erilaisia leasingin arvostusmene- telmiä, joita voidaan käyttää lentokoneen rahoituspäätöksen arvioinnissa ja sitten kokeilla näitä menetelmiä käytännössä Finnairilta saadulla aineistolla. Tutkimus perustuu uuden Airbus A330- 300 lentokoneen hankintaan. Olennaisin kysymys on pitäisikö lentokone ostaa vai liisata operatii- visella leasing-sopimuksella. Tämä johtaa varsinaisiin hypoteeseihin eli onko operatiivinen leasing kannattavampaa kuin ostaminen alle 10 vuoden tai pidemmällä aikavälillä. Tutkimuksen myötä Finnairille valmistuu malli rahoituspäätöksen analysointiin.
Tutkimusmenetelmä ja lähdeaineisto
Tutkimusmenetelmänä on yhden yrityksen case-tutkimus. Analyysini perustuu kassavirtapohjai- siin arvostusmenetelmiin kuten Nettonykyarvo-menetelmä (NPV) ja sen edistyneempi versio Oi- kaistu nykyarvo-menetelmä (APV). Mallin tuloksia tutkitaan herkkyysanalyysin avulla ja paranne- taan riskianalyysi-työkalulla, joka perustuu Monte Carlo-simulaatioon. Siinä simulaatio ajetaan tuhat kertaa jolloin saadaan nykyarvojen jakauma. Aineistona käytetään ulkopuolisen arviointiyri- tyksen tuottamia nykyarvoja ja ennusteita A330-300 markkina-arvoista ja leasing-maksuista.
Tutkimustulokset
Ensimmäinen hypoteesini ”Operatiivinen leasing on kannattavampaa kuin ostaminen alle 10 vuo- den aikavälillä” hyväksyttiin selvästi tulosten ollessa kiistattomia sekä NPV että APV- menetelmillä. Toista hypoteesia, että edellinen pitää paikkansa myös pidemmällä aikavälillä, ei voitu vahvistaa. Vaikka APV -menetelmä edelleen vahvasti puoltaa leasingia, NPV-menetelmän mukaan ostaminen tulee kannattavammaksi, kun aikaväliä pidennetään. Tilastollisesti leasing silti osoittautuu kannattavammaksi. Yhteenvetona todettakoon, että mallini mukaan nykyisessä mark- kinatilanteessa Finnairin tulisi mieluummin liisata A330-lentokone operatiivisella leasing- sopimuksella kuin ostaa se. Tämä pätee varsinkin, jos suunniteltu käyttöaika on suhteellisen lyhyt.
Avainsanat Leasing, Operatiivinen leasing, Rahoituspäätös, Kassavirta-pohjainen arvostus, Net- tonykyarvo, Oikaistu nykyarvo, Monte Carlo-simulaatio, Lentokone, Finnair, Airbus, Ilmailu, Len- toyhtiöt
TABLE OF CONTENTS
1 INTRODUCTION ... 1
1.1 MOTIVATION AND BACKGROUND OF THE STUDY ... 1
1.2 RESEARCH OBJECTIVES & HYPOTHESES ... 3
1.3 METHODOLOGY OF THE STUDY ... 4
1.4 STRUCTURE OF THE STUDY ... 4
1.5 FINDINGS OF THE STUDY IN BRIEF ... 5
2 CASE ... 5
2.1 COMMERCIAL AIRLINE INDUSTRY - OVERVIEW ... 5
2.1.1 Current market outlook ... 5
2.1.2 Future market outlook ...11
2.1.3 Aircraft financing environment ...15
2.1.4 Aircraft leasing ...18
2.2 PRESENTATION OF THE CASE COMPANY ...22
2.2.1 Finnair in 2013 – Strategy and outlook ...22
2.2.2 Current fleet and aircraft financing ...27
2.2.3 Financing decision analysis in Finnair ...31
2.3 ACQUISITION OF AIRBUS A330-300 ...31
3 THEORETICAL FRAMEWORK ...34
3.1 DEFINITIONS...35
3.2 ACCOUNTING AND TAX TREATMENT DISCREPANCIES ...36
3.3 RELATED LITERATURE ...38
3.3.1 The birth of leasing valuation ...38
3.3.2 Lease valuation based on non tax-incentives ...42
3.3.3 Flexibility and other reasons why airlines lease ...45
3.3.4 Residual value - aircraft valuation - asset liquidity ...51
3.3.5 Estimating the cost of capital and risk adjustment ...59
3.3.6 Valuation techniques actually used in airlines ...62
3.3.7 Lease as a substitute for debt?...66
4 DATA AND METHODOLOGY ...67
4.1 DATA ...67
4.2 IMPLEMENTATION OF THE STUDY ...71
4.2.1 Research method ...71
4.2.2 Assumptions ...72
4.2.3 CAPM – Capital asset pricing model ...74
4.2.4 WACC – Weighted average cost of capital ...75
4.2.5 NPV – Net present value ...77
4.2.6 APV - Advanced present value ...78
4.2.7 Sensitivity/break-even analysis ...79
4.2.8 Risk analysis with Monte Carlo simulation ...80
5 PRESENTATION OF RESULTS ...81
5.1 NPV & APV ...82
5.2 SENSITIVITY ANALYSIS ...83
5.3 MONTE CARLO SIMULATION...88
6 CONCLUSION ...90
6.1 LIMITATIONS AND SUMMARY OF THE STUDY ...90
6.2 FUTURE RESEARCH...92
7 REFERENCES ...93
8 APPENDICES ... 100
TABLE OF FIGURES & GRAPHS
Figure 1. Finnair’s route structure in 2013. Source: Finnair. ...24
Graph 1. Airline net post-tax profit margins. Source: ICAO, IATA. ... 8
Graph 2. Jet fuel and crude oil price. Source: Platts, RBS. ... 8
Graph 3. Total load factors on passenger and freight markets. Source: IATA. ... 9
Graph 4. Return on invested capital in airlines and their WACC. Source: IATA. ...10
Graph 5. World economic growth and airline profit margins. Source: IATA. ...10
Graph 6. World annual traffic in RPKs since 1970. Source: ICAO, Airbus. ...12
Graph 7. Annual growth and RPK’s. Source: ICAO, Boeing ...12
Graph 8. World annual RPK – forecast. Source: ICAO, Airbus. ...13
Graph 9. Global fleet development, 2012-2031. Source: Airbus. ...14
Graph 10. Aircraft financing environment. Source: Boeing. ...15
Graph 11. Sources of financing for Boeing deliveries. Source: Airbus. ...17
Graph 12. Historical growth of operating lease fleets. Source: Ascend. ...18
Graph 13. Top 10 aircraft lessors by fleet value. ...19
Graph 14. Finnair’s passenger revenue split in Q3 2012. Source: Finnair....23
Graph 15. Finnair’s debt ratios and cash flows. Source: Finnair....25
Graph 16. Finnair’s asset and liabilities. Source: Finnair. ...26
Graph 18. Lease commitments and operating lease liabilities in Finnair. Source: Finnair. ....30
Graph 19. Development of A330 share of all widebodies. ...34
Graph 20. Estimated future values of A330-300 in US-dollars, in three different states of economy during twenty-year period. Source: The Aircraft Value Analysis Company. ...71
Graph 21. Net and adjusted present values in US-dollars according to eight- and sixteen-year time period and with worst, mid and best states of the economy. ...82
Graph 22. Sensitivity of present values to price, t = 8. State of the economy “Best”. ...84
Graph 23. Sensitivity of present values to price, t = 16. State of the economy “Mid”. ...84
Graph 24. Sensitivity of present values to lease rates, t = 16. State of the economy “Mid”. .85 Graph 25. Sensitivity of present values to price, t = 16. State of the economy “Best”....85
Graph 26. Sensitivity of present values to residual value, t = 16. State of the economy “Mid”. ...86
Graph 27. Sensitivity of NPV to WACC, t = 16. State of the economy “Best”. ...87
Graph 28. Sensitivity of APV to cost of debt, t = 16. State of the economy “Best”. ...87
Graph 29. Monte Carlo simulation. Normal distribution of NPV and APV, t=8. ...89
Graph 30. Monte Carlo simulation. Normal distribution of NPV and APV, t=16. ...90
TABLE OF EQUATIONS Equation 1. Capital Asset Pricing Model, CAPM. ...74
Equation 2. Weighted average cost of capital, WACC. ...75
Equation 3. Net present value. ...77
Equation 4. Adjusted present value. ...78
TABLE OF APPENDICES Appendix 1. Finnair key figures in 2012. Source: Finnair. ... 100
Appendix 2. The amount of unencumbered and encumbered aircraft in Finnair. ... 101
Appendix 3. Financing decision model. Net Present Value and Adjusted Present Value. ... 102
Appendix 4. Monte Carlo Simulation results and frequency graphs. ... 103
Appendix 5. Break-even values of purchase price and residual value in millions of dollars. 104 Appendix 6. Break-even values of WACC, cost of equity and cost of debt in percentages. .... 104 Appendix 7. Break-even values of lease rate changes in percentage. ... 104
1 INTRODUCTION
1.1 Motivation and background of the study
Since the beginning of leasing related literature the burning question of to lease or purchase has confused both academic and business world. Arguments from tax benefits to off-balance sheet characteristic and from capital preserving advantages to flexibility have been expressed.
Many theories have merged, some more accepted than others, but main reasoning still remains around tax and accounting benefits of leases. Also the substitutability of the lease and debt surrounds many current discussions. Present understanding is that they might not after all be perfect substitutes which would rationalise leasing and have implications on firms’ optimal capital structures as well. In addition, today an ever-increasing focus is given on non-financial features that leasing provides and how they could be properly measured. Flexibility gained from leasing is one of the most commonly heard justifications in the literature but to indisputably measure it is a much more complicated story.
As a method of financing, leasing seems to be ever so popular at the moment. Especially in the airline industry leasing seems to be increasing. Gritta et al. (1994) reported that main US carriers already had 54% of their fleet leased in 1991. According to CIT (2011), 38% of the current world fleet of aircraft has been leased compared to only 3% in 1980. This percentage is now expected to rise above 50% by 2015. Gibson and Morrell (2004) find that about 25%
of the aircraft are flown under an operating lease. Current economic conditions also have an effect on this but it should be stated that leasing isn’t any more just a financing method for financially constrained companies as it used to be. It can be rather seen as a modern, strategic financing tool that enables very flexible fleet planning needed in this turbulent and constantly changing environment.
When considering an airline company whose balance sheet is comprised mainly of expensive aircraft the lease or purchase question becomes very valid. Minor benefits gained from the correct financing decision can make a big difference when assets are worth hundreds of millions of dollars. But what makes this complicated is first, academic literature is not omniscient and second, the industry is highly cyclical and uncertain, and thus the analysis of the financing decisions is difficult. Most often non-financial or operational reasons are used to advocate leasing over debt. But that leads to a need for valuation methods beyond financial
aspects which furthermore leads to subjective opinions and choices in valuation. So far, it might already be evident that we are on an unravelled territory.
Today, airline business is recovering from the worldwide depression and is trying to return on profit by increasing the amount of passengers while cutting the unit costs. A revival seems to be already underway and future shows glimpse of hope in this highly cyclical industry. What comes to airline financing today, naturally both debt and leasing is used but there is now ever so increasing trend of promoting particularly operating leases. They seem to offer flexibility desired by airlines in this uncertain state and perhaps assist companies with low cash reserves or uncertain future cash flows. That said, the role of the lessors in the aviation leasing business seems to be emphasized in past few years. At the same time, leasing has become a strategic source of flexibility to many of the world's major airlines.
It is clear that no one comprehensive and clear answer to this lease or purchase dilemma exists but by exploring several different perspectives and theories this thesis tries to offer better understanding of the complexity of this decision as a whole. At the same time this thesis aims to introduce some theoretical models from existing literature and compare their suitability to the case company’s needs so that best of them could be used in the case company’s decision making process in the future. The need for this kind of analysis seems to be apparent because finance departments of airlines do not necessarily capitalize on all useful methods available. (Gibson and Morrell, 2005)
In industries like airline business where the assets consist mostly of airplanes this kind of analysis has a great importance and creates concrete benefit. Increasing trend of operating leases and increased role of the lessors in the airline business makes this topic very current.
What makes this topic also very current is that changes in IFRS account policies probably during the year of 2013 have significant effects on treatment of leases, especially operating leases which can be seen as off-balance sheet items (although they have been disclosed in the notes to the accounts). However when implemented new IASB and FASB Proposals state that all leases would need to be recorded on balance sheet as the present value of the “right-to- use” asset and a corresponding lease liability. The purpose of these changes is to make financial statements even more transparent and comparable. Companies with lots of operating lease liabilities have to be prepared. The effect of policy changes on certain key ratios and therefore on credit ratings cannot be ignored.
In their survey in 2005 Gibson and Morrell discover distinct differences in airlines’ financial evaluation methods, interactions between investment and financing decisions and risk management. They find that airlines do not appear to consistently capitalize on the most advanced techniques available in the market. This may sound peculiar considering the extent of assets in airline business. However, managers are not all to blame for. This under-usage of methods may be explained by the fact that managers have not unlimited time to study all new researches. This observation raises even more the importance of this kind of comparison of the different valuation methods in airlines.
1.2 Research objectives & Hypotheses
Fortunately I was given an exceptional opportunity to implement different methods in real life. Finnair, the major airline in Finland, provided the setting needed to apply relevant theories to practice. The purpose of this thesis is to present different valuation techniques from the existing literature that can be used when assessing a procurement of an aircraft and then test these methods in practice with the actual data provided by Finnair. The case framework used is an acquisition of a new Airbus A330-300 widebody airliner, which Finnair already has eight in its fleet. This thesis provides a selection of techniques that can be used in the future in the case company and enables an interesting opportunity to test these theoretical models in action. The effects and implications of the usage of different techniques are then discussed and compared. The eventual aim of my thesis is to provide a model for Finnair that can be used in real life with a set of inputs to analyse this financing decision.
An acquisition comprises an investment and a financing decision, at least in theory. The purpose here is particularly to analyse the financing decision and the problematic of deciding whether to purchase or to lease an aircraft. This means that the investment decision has already been done and now it is relevant to examine how to finance the acquisition. Many experts, however, suggest that these two decisions cannot and should not be separated in real life because of their strong influence on another. If you first choose the aircraft and only then analyse how to finance it you might not end up with the best result. One important reason for this is that different aircraft manufacturers can offer quite different finance terms. The fleet planning and acquisition of aircraft should from the start of the process be connected to the finance. However, because fleet planning escapes from the scope of this thesis, it is simpler to study the financing decision in isolation. The thesis will present both financial and non- financial aspects of the leasing dilemma and utilize a combination of different cash flow
based models from the academic literature to achieve the best possible solution for this rather complicated question. It is rather matter of using an appropriate and versatile tool set than relying only on some one method.
In addition to providing a model for Finnair, my thesis tries to answer a couple of relevant questions. Leasing is often thought to be more expensive than purchasing. A lessee is seen to make a choice between the decreased risk and increased price. However, because of the increased popularity of leases, one might argue that this is because leases are actually under- priced and therefore cheaper than the costs of actually buying an asset. Therefore, I will first ask if operating lease is cheaper than purchasing in typical time period of aircraft lease. This is followed by a supplement question does this also hold when the time period is extended.
This is also relevant question as it is commonly referred that leases are preferable in short time horizons but purchasing is always better option in the long run. So, my hypotheses are:
H1: Operating lease is more cost-effective than purchasing in less than 10 year period.
and
H2: Operating lease is more cost-effective than purchasing in the long run.
1.3 Methodology of the study
My analysis will be based on cash flow-based valuation techniques such as Net Present Value (NPV) and its more advanced derivative adjusted present value (APV). I will then enhance the model with a sensitivity analysis and further with a sort of risk analysis tool utilizing Monte Carlo simulation where a thousand simulations are made to find the deviation of net present values. This measure makes it possible to explain with what probability the present value is for example positive and thus favours leasing. My analysis will exclude non-cash flow based models like real options analysis due to their challenging framework and a heavy required involvement of the management.
1.4 Structure of the study
The thesis is constructed as follows: It begins with this introduction chapter and then continues to present the case in chapter 2. Chapter 3 reviews definitions and previous literature and is followed by data and methodology presentation in chapter 4. Chapter 5 discusses about the results while chapter 6 finally concludes. References and appendices are found in the end of the study, in chapters 7 and 8.
1.5 Findings of the study in brief
The thesis presents literature and different valuation methods of leasing and uses cash flow based methods like NPV and APV to determine whether it is preferable to purchase an Airbus A330 airliner for Finnair or operate one under an operating lease agreement. My first hypothesis, “operating lease is more cost-effective than purchasing in less than 10 years' time”, was quite clearly accepted as the results from both NPV and APV were indisputable.
The second hypothesis, that the above holds also if the time period is extended, remains unanswered or can even be rejected. Although APV still very strongly suggests leasing over purchasing, NPV starts to draw nearer to purchasing. Still statistically leasing is the preferable choice but it is apparent that when the time period is lengthened, the purchase becomes more tempting. In brief, it seems that in current market environment Finnair should lease the A330 under an operating lease agreement rather than buy it. This is true especially if they are considering a rather short deployment. Although interest rates are low which could encourage direct debt finance, this theoretical model illustrates that financing costs of leasing are lower than costs related to purchasing.
2 CASE
This chapter will now introduce the case studied. Chapter will start with an industry outlook including a presentation of aircraft finance business as a whole. It will continue then by introducing the case company and the specific acquisition under the loop of my thesis.
2.1 Commercial airline industry - overview 2.1.1 Current market outlook
Airline industry has always had its turbulences and the cyclicality comes with the business, and not least today. The industry has been forced to face one of the greatest and probably long-lasting challenges to date. The current global crisis or recession has been on-going since the end of 2007 and has taken many forms from burst of housing bubble in the United States to the credit crunch and from financial to European sovereign debt crisis. Although maybe the worst part could be already over, this prolonged state of instability and imbalance is toxic for airlines. The thick veil of uncertainty at the moment is evident and dominates the current market outlook. The economic environment is challenging altogether but especially for airline business which is very sensitive to overall condition of the economy. As a service industry,
air transport is heavily dependent on the state of the economy for its growth. When economy is struggling, it is felt immediately in airlines as business passengers dissolve to economy and the demand for air travel is decreased as a whole. In addition to economic conditions, also many other factors affect directly to airlines. Political tensions and wars naturally have an effect on oil prices and therefore on flying. Natural disasters like earthquakes and following tsunamis in Asia in 2004 and 2011 can decrease the demand of air travel substantially.
Terrorist attacks such as those in 11.9.2001 in the United States can also have long-lasting effects. Furthermore, also major health issues like SARS or bird flu have seen to have an instant and powerful, and sometimes local, impact on passenger amounts and profitability of the airlines. What is common in all these events is that the negative effect on the industry can be noticed quickly whereas the revival from it is much slower.
Because of recent difficulties in economy, airline industry faces clear pressure for cost cuts.
Profitability needs improvement as profit margins are low and the demand can be insecure.
Meanwhile the cost structures are generally quite heavy in many traditional airlines, including Finnair. This has forced many airlines, again like Finnair, to introduce efficiency measures to push down costs. Especially fixed costs need to be brought down. Naturally also operating costs are tried to be diminished.
However, cost cuts are only a temporary solution. Airlines need to be profitable to sustain in the long run. Airline industry has historically been characterized by cyclicality, sensitivity and unfortunately low-profitability. Introduction of low-cost carriers have complicated the traditional air carriers’ situation even further. LCC’s have changed the field permanently by dumping prices and offering overcapacity with totally new business models and low cost structures. The heavy price competition is just one example of these newly witnessed features of the modern competition. Today bankruptcies are pretty common and consolidation is ever so popular, and not just through mergers and acquisitions but also via alliances. A rising trend is also privatization of carriers. Because of long traditions of being national necessities, airlines are historically government-owned. To become more market-oriented, many companies have been privatized during the last two decades. Finnair is actually one of the remainders of that privatization wave along with British Airways, Lufthansa and Iberia.
Overall, I think it is reasonable to say that the whole business is in a sort of turning point. This revolution will eliminate the weakest competitors and only those who can adapt to today’s market and its regularities can survive.
So, for airlines it is crucial to be able to adapt quickly to changing environment and to react to demand changes as quickly possible. This is what makes leasing so preferable in today’s world of aviation. The flexibility is crucial to cope with the competition. In a highly capital intensive industry, this effect is emphasized. However, before explaining the finance field of airline business I will review the current market conditions followed by future outlook.
According to Oxford Economics every year approximately 2.5 billion passengers and 50 million tonnes of freight are flown worldwide. 1 In 2007, European airlines alone transported about 700 million passengers and carried 10 million tonnes of freight. The global industry produces annual revenues of over $600 billion as IATA presents.2
In their December 2012 outlook and January 2013 financial monitor3, IATA, The International Air Transport Association, forecasts $6.7 billion airline net profits in 2012.
Despite continued high fuel prices and a slowing world economy, airline profits and cash flows managed to stay at levels similar to 2006/7, when economic environment was stronger and oil prices $40 lower per barrel. Profits are still lower than in 2011 but yet better than expected due to challenging business environment.
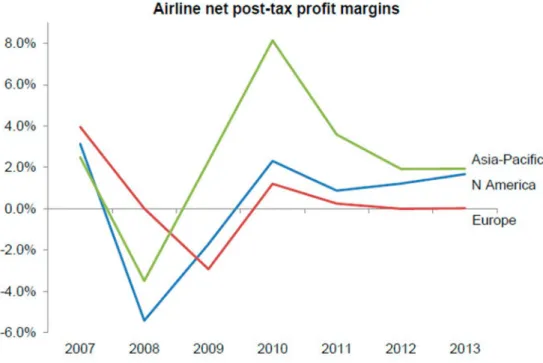
2012 started poorly but the second and third quarter showed an improved performance. This is mainly achieved by improved industry structure and airlines reacting to challenges with cost cuts. During the last quarter profits seemed to be settling but were still positive. Globally, the best performers are Asia-Pacific area and North America while Europe will only break even. That is, however, a solid achievement considering the damaged home markets due to Euro-zone crisis. IATA forecasts zero profit for Europe also in 2013.
1 http://www.oxfordeconomics.com/publication/open/222513, retrieved 9.10.2012
2 http://www.iata.org/pressroom/facts_figures/fact_sheets/Documents/industry-facts.pdf, retrieved 6.3.2013
3 http://www.iata.org/whatwedo/Documents/economics/Industry-Outlook-December2012.pdf,
http://www.iata.org/whatwedo/Documents/economics/AirlinesFinancialMonitorJan13.pdf, retrieved 25.2.2013
Graph 1. Airline net post-tax profit margins. Source: ICAO, IATA.
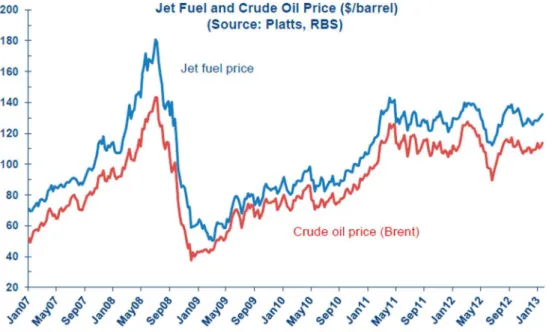
Jet fuel prices have fluctuated around $130 a barrel for the past two years. There has been upward pressure on prices during 2012 which eased momentarily towards the end of the year but continued after OPEC cut crude oil production in December. This caused price to jump back above €130/bbl in January. Jet fuel prices have not increased substantially during past two years but they are considerable higher compared to pre-2010 levels. A higher kerosene price seems to be a new standard and this will have a great impact on airline profitability.
Graph 2. Jet fuel and crude oil price. Source: Platts, RBS.
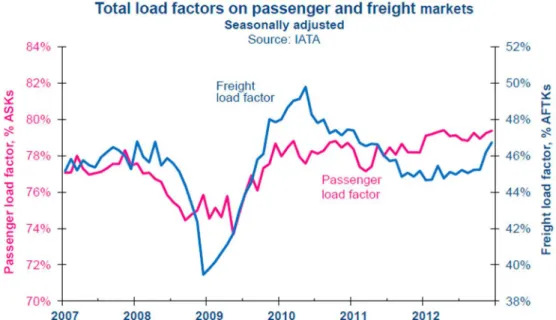
A noticeable trend of 2012 was that airlines kept capacity growth below the increase in demand. This means that airlines are increasing their operations at slightly lower rate than the increase in demand. This is being done despite the strong number of new aircraft deliveries.
As a result the load factors have increased and remained at record-high levels throughout the whole year.
Graph 3. Total load factors on passenger and freight markets. Source: IATA.
Also a distinct feature in today’s aviation market seems to be consolidation. It is most obvious on the US domestic market, where several mergers have contributed to the stability of capacity. Also new joint ventures have been witnessed. In Europe, the industry structure has been reshaped by exits. These concern both low cost carriers (LCC’s) as well as network carriers. IATA explains that although the stronger airlines have improved their performance, the weak have got weaker and this has caused several bankruptcies. The number of start-ups has decreased substantially as a result of the financial crisis due to difficulties to raise finance.
These changes in industry structure have been a significant factor in airline business resurrection. Airlines have been given a chance to gain from their efficiency measures and protect their cash flows while encountering weak economic growth and high fuel prices.
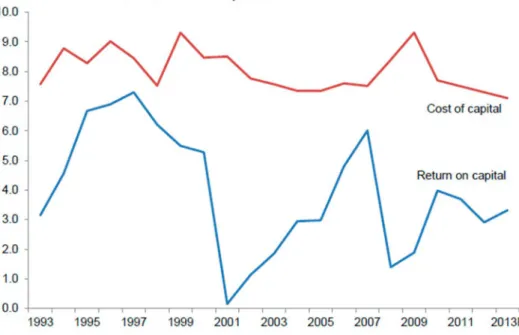
However, that hasn’t changed the fact that the industry remains highly competitive and the profitability and returns on capital remain very weak. As IATA describes, in a normal industry competition would force returns down to the cost of capital (WACC) but in the
airline industry competition is so intense that even in the good years returns on invested capital fail to reach the industry’s cost of capital.
Graph 4. Return on invested capital in airlines and their WACC. Source: IATA.
In addition to already challenging business environment, the global economic growth has been very slow. The global GDP growth is close to 2% which has historically turned out to be a critical point where after airline industry profits turn to losses.
Graph 5. World economic growth and airline profit margins. Source: IATA.
Both passenger and freight markets finished 2012 strongly, supported by a further increase in business confidence. Even in difficult market environment, air traffic managed to grow 5.3%.
This is in line with the long term averages and future forecasts by Boeing and Airbus reviewed later. Large airlines achieved EBITDA figures between 10-15%. Finnair’s respective figure was 7%.
2.1.2 Future market outlook
Based on the better performance of the industry in 2012, IATA has revised their forecast of industry profits in 2013. They expect the net post-tax profits to cumulate up to $8.4 billion this year which means a small, but less than expected, improvement from the year 2012. The growth is expected to be driven by slightly higher economic growth and slightly lower fuel prices. Anticipation for global economic growth, however, has been vanished. Overall, the global air travel is expected to increase but the growth can be slow. In addition, airline capacity management allows load factors to remain solid, thus helping financial performance.
However, because of uncertainties in global economic growth, the demand for air transport remains fragile. According to IATA Business Confidence Survey, the survey made among airlines, Airline business confidence improved in January. Despite the global economic weaknesses, respondents showed improved profitability expectations in the next 12 months.
Restructuring and consolidation actions together with efficiency measures have helped airlines and increased their confidence in the future.4
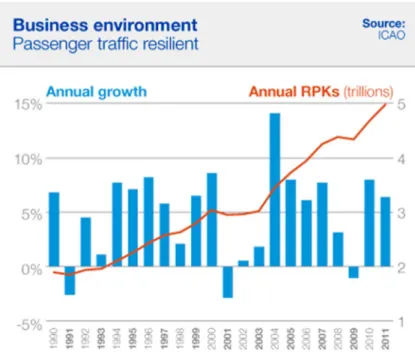
European aircraft manufacturer giant Airbus considers it remarkable that although the industry is facing one of its biggest challenges at the moment, it still has managed to grow over 50% since 2000 when measured with RPK.’s.5 Indeed, this time period includes such events as WTC attack, SARS and on-going financial crisis. This shows incomprehensible adaptability of the industry and confirms the constantly increasing demand for air travel. The graphs below illustrate how resilient the traffic growth in the end is to external shocks. Of course the impact of Gulf War, WTC attacks and global financial crisis are clearly seen in annual growth rates but annual RPK’s are at worst remained constant. As Airbus puts it, people want and need to fly and that’s the base of their future forecast as well.
4 http://www.iata.org/whatwedo/Documents/economics/BCS_Jan_13.pdf, retrieved 2.3.2013
5 Revenue passenger kilometres (RPK) is a common measure of the volume of passengers carried by an airline
Graph 6. World annual traffic in RPKs since 1970. Source: ICAO, Airbus.
Graph 7. Annual growth and RPK’s. Source: ICAO, Boeing
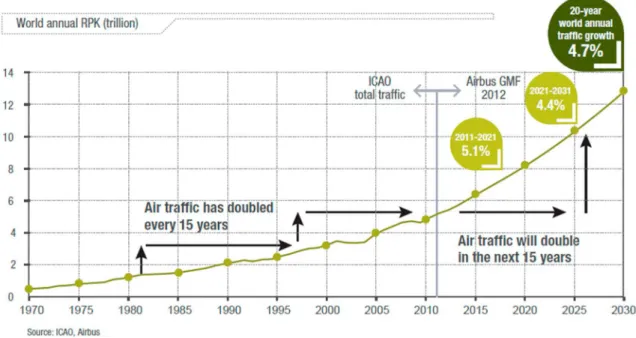
Airbus presents that the growth in airline business has come so far from the demographic evolution, increased wealth, progressive liberalization of air transport, globalization and availability of efficient, operationally capable aircraft. In the future, however, the two main factors driving the growth according to Airbus are global economic activity and the price of
travel. The growth seems to be approximately 5% annually. Both Airbus and Boeing forecast the average growth rate to continue as same 5% by year 2030. 6
Graph 8. World annual RPK – forecast. Source: ICAO, Airbus.
Airbus expects the growth to be driven by emerging regions, especially China. China is currently the fastest growing market with lots of people, bigger cities and more wealth. An increased middle class means more first time fliers while the demand is stimulated by growing tourism and internationalization. Asia-Pacific area is an essential part of the global economy today, representing more than a quarter of it. Airbus describes how the economy in this area is growing 2.5 times faster than in Europe. This makes the region a main driver of global economic growth and air transport. In the future, its importance will be further emphasized as its market share is estimated to top one third of the world economy within twenty years. Airbus estimates that 56% of the economic growth between 2011 and 2031 will come from emerging regions. The three largest regions, as per airline bases, will be Asia- Pacific, Europe and North America with traffic contributions of 32%, 24% and 20%, respectively in 2031. The economic world in 2031, however, is probably quite different from today. China, the 3rd largest economy today, will soon take the second place over Japan while India, 8th at the moment, is estimated to squeeze into top three world economies by 2025. This estimated growth especially in Asia is naturally of the utmost importance to Finnair, whose core business will be long-haul flights to that region. More about Finnair’s perspective will be
6 http://www.boeing.com/commercial/cmo/pdf/Boeing_Current_Market_Outlook_2012.pdf, retrieved 29.10.2012
covered later in this chapter. But overall, despite the positive outlook in the long run, the next few years may offer airlines still considerable challenges due to highly insecure environment.
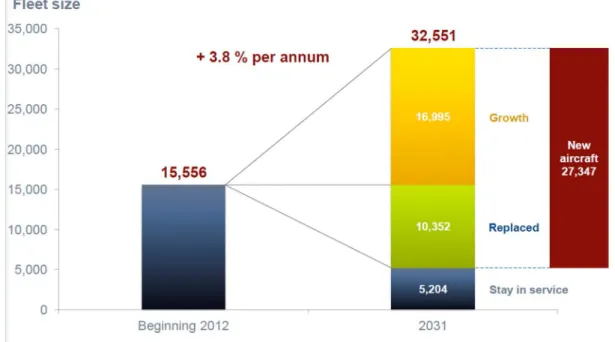
This growth means naturally more aircraft. The Airbus Global Market Forecast (GMF)7 for 2012-2031 reveals a need for over 27,000 new passenger airliners delivered within that time frame. The Global Market Forecast also anticipates a more than doubling of the world’s overall passenger aircraft inventory, from 17,000 in today to more than 35,500 by 2031.
Boeing is even more courageous by estimating the need for 34,000 new airplanes to increase the total fleet to almost 40,000 aircraft in 2031. Today, 85% of all aircraft in the world is being delivered by these two main manufacturers, European Airbus and American Boeing.8 During 2012 they delivered 588 and 601 commercial aircraft, respectively. According to Aircraft Finance Report 2013 prepared by Flightglobal.com, net orders for Boeing and Airbus totalled 2036 aircraft accounting for a highest ever combined order backlog of 9055 aircraft.
Graph 9. Global fleet development, 2012-2031. Source: Airbus.
7 http://www.airbus.com/company/market/forecast/?eID=dam_frontend_push&docID=27599, retrieved 2.3.2013
8 http://www.flightglobal.com/airspace/media/reports_pdf/emptys/102389/aircraft-finance-2013.pdf, retrieved 2.3.2013
2.1.3 Aircraft financing environment
According to Boeing9, stable demand growth together with high jet fuel prices is the key element which drives the aircraft replacement willingness to more fuel efficient airplanes.
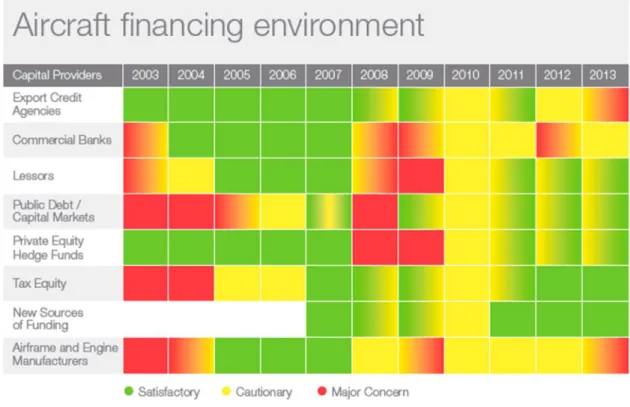
Main manufacturers have record-long backlogs which means long waiting times and scarcity of delivery positions. Boeing believes that this will ensure adequate availability of capital for airlines to fund the deliveries. Boeing expects aircraft financing markets to be liquid in 2013 despite the uncertainty but they are concerned about increasing fees and equity requirements for export credit transactions. At the same time, commercial bank debt is suspected to become more restrictive and expensive. Therefore, the role of the lessors and capital markets will be emphasized.
Graph 10. Aircraft financing environment. Source: Boeing.
During 2013, the aircraft industry are expecting deliveries worth roughly $104 billion, an increase of 10% from $95 billion this year, says Kostya Zolotusky, managing director at Boeing Capital Markets in Businessweek.10 95% of these deliveries come from Airbus and Boeing. He expects this figure to go up to $132 billion in 2017. So clearly this is a large and
9 http://www.boeingcapital.com/cafmo/brochure.pdf, retrieved 27.2.2013
10 http://www.businessweek.com/news/2012-12-04/boeing-says-aircraft-financing-will-reach-104-billion-record, retrieved 27.2.2013
constantly expanding business. The burning question today is who will finance all these deliveries?
The graph above illustrates the diversity of the aircraft financing environment. As Boeing explains in their Current Aircraft Finance Market Outlook11, the sources of aircraft financing are changing because of the financial crisis in Europe. Timothy Myers, Vice President and General Manager of Aircraft Finance in Boeing, recognizes this change. He explains how traditional aircraft financiers, European banking community, are facing increased challenges and this has caused a shift in a market place. Also new regulations like Basel 3 are affecting these institutions. For 2013, the bank debt market appears to be stronger than year ago and more globally diversified as well. European banks continue to dominate but for example Japanese banks are expected to return to global markets with the support of banks from United States, Australia and Middle East. China recently loosened its monetary policy and this will increase the share of Chinese banks as financiers of domestic deliveries. Overall, Boeing believes that commercial bank market will improve in 2013.
Previously popular financing source, accounting for almost a third of all financing, the government backed-up export credit will become more expensive as the new Aircraft Sector Understanding (ASU) by Organisation for Economic Co-operation and Development will be fully implemented. This means higher fees and equity requirements. It is estimated that the new ASU will raise the credit premium for all borrowers but the stronger, and better rated, airlines will suffer the most from this new agreement.12 Therefore the export credit support for new aircraft deliveries is expected to decline in 2013 as airlines will choose other more attractive options like commercial debt financing or operating leases, explains Kostya Zolotusky in Flightglobal’s Aircraft Finance Report 2013.
Zolotusky and Myers agree that this current setting will push more and more airlines to choose leasing rather than buying an aircraft. Myers believes that operators’ fundamental desire isn’t to own aircraft but focus on their main task, to fly people. Boeing reasons that with export credit and commercial bank debt available to fewer customers and at higher prices, more airlines are likely to lease airplanes. According to Flightglobal, operating leasing companies reached a 40% market share of new deliveries at Airbus in 2012. Boeing strongly believes that half of the global fleet is under an operating lease in ten years' time.
11 http://www.boeingcapital.com/cafmo/brochure.pdf, retrieved 27.2.2013
12 http://www.flightglobal.com/airspace/media/reports_pdf/emptys/102389/aircraft-finance-2013.pdf, retrieved 2.3.2013
The next natural question is where will the lessors find their financing? Lessors are used to be more self-funded but today only 5% of deliveries are financed from their parent companies’
balance sheets. According to Scheinberg (2010), many corporate parents suffered from the recent economic collapse and lost large fortunes. Without the support form their parent, leasing companies are forced to turn to other options. Boeing thinks rapidly increasing participation of new and returning commercial banks together with a significant expansion of capital markets funding is the answer for the question above. Boeing’s Zolotusky states that capital markets have become more important for lessors and foreign (not US-based) carriers.
U.S. airline have traditionally used capital markets more extensively but now this trend is also landing in Europe. Boeing expects capital markets’ contribution to increase significantly in 2013 resulting to segment financing 15 per cent of aircraft deliveries next year, up from 6 per cent in 2012. This will compensate the expected decline of credit export of 7 per cent.
In addition to previously mentioned methods, Boeing reminds that the environment is still very uncertain and manufacturers may be forced to support buyers with some backstop financing for future deliveries. Myers adds that the industry may see an increased amount of also other forms of financiers, such as pension funds, insurance companies and sovereign wealth funds. He thinks that these are very ideal aviation financiers because they have long- term liabilities they need to match the assets with and aircraft are a perfect choice for that.
Graph 11. Sources of financing for Boeing deliveries. Source: Airbus.
2.1.4 Aircraft leasing
According to recent estimates, the increasing trend of operating leases in modern aviation business is evident as approximately one-half of the world's aircraft fleet is operating under some kind of lease and according to Gavazza (2010b) about one third specifically with the operating lease. Indeed, there is an increasing trend in favour of short-term operating lease.
For example, Gritta et al. (1994) reported that, for a sample of major US carriers, percentage of planes leased increased from 19% in 1969 to 54% in 1991 and the percentage of aircraft under operating leases to total leased aircraft increased from 13% in 1969 to 82% in 1991.
The share of new aircraft acquired by operating lessors has increased from close to zero in the early 1980s to above 40% recently13. According to Ascend, an aviation consultancy14, leasing is actually more pronounced especially in Europe and Latin America. They state that even 44% of aircraft in Europe are leased. As previously mentioned, Boeing expects that leasing will represent over half of worldwide fleet by 2020. In this thesis operating leases are being studied because of their dominating prevalence in capital financing of airlines.
Graph 12. Historical growth of operating lease fleets. Source: Ascend.
13 http://www.flightglobal.com/airspace/media/reports_pdf/emptys/102389/aircraft-finance-2013.pdf, retrieved 2.3.2013
14 http://www.ascendworldwide.com/Ascend-OperatingLessorAnalysis_Q4-2010.pdf, retrieved 2.3.2013
Boeing estimates that there are currently over 150 lessors in the world and more than 700 customers in some 140 countries around the globe. Ascend describes that the amount of lessors has doubled in recent twenty years. However, the industry is led by only few large players. The pioneer in aircraft leasing, ILFC, together with another huge lessor GECAS are clearly dominating the market with a combined market share of about one third. Ascend continues that historically top 5 lessors have controlled about half of the leased fleet. Moreover, economist Paul Sheridan from Ascend notes that of the world's four largest owners of airliners, two are lessors.
GECAS has a fleet of 1,732 planes and ILFC 1,031. The biggest airline at time of the article measured with fleet size was
Delta, which owned “only” 800 aircraft.15 In this kind of market, the experience, outlook, market power and purchase power of leasing companies is clear.
In Airline Fleet Management’s January – February issue16, Bill Collins, VP for leasing and asset management sales at Boeing, reasons for this increasing popularity of leases. According to him, the main reason is the low profitability of airlines, thus finding them hard to purchase an aircraft outright. He explains that airlines are trying to maintain liquidity and keep their liabilities off their balance sheets. As leasing holds capital costs down, it is most appealing to capital constrained airlines. He also reluctantly admits that highly experienced lessors have become market experts and airlines appreciate this increased consultant role of leasing companies. Collins clarifies that lessors are nowadays actually financing companies with better and cheaper access to financing. This is what makes them more profitable than airlines,
15 http://www.economist.com/node/21543195, retrieved 1.10.2012
16 http://viewer.zmags.com/publication/8477a87d?page=1#/8477a87d/41, retrieved 25.2.2013
Graph 13. Top 10 aircraft lessors by fleet value.
Source: Flightglobal
continues previously mentioned Kostya Zolotusky. Zolotusky continues that because commercial lenders will focus more and more on better rated customers, many airlines are unable to purchase aircraft and therefore the leasing business will grow even faster. The Boeing executive also stresses the importance of airline’s own long-term desires when considering lease-versus-purchase question. Many airlines are beginning to think that it may be better to someone else to own the assets, treat them as investments and bear the associated risks. The drawback of leasing is of course tightened cash flows because of all airplane utilization and rent payments. So, owning an aircraft produces cash-flow flexibility but in order to gain from the owning, airline needs to make profit to have the taxation benefits.
Dick Forsberg17, a head of strategy of an aircraft lessor, is in line with Zolotusky and says that aircraft leasing is far more profitable and less risky business than airline business itself. He explains how lessors are less exposed to external variations directly and because of long-term agreements their cash flow is more stable. However, lessors do expose themselves to credit quality of their customers, airlines. Forsberg continues how despite volatility of air transport industry during past twenty years aircraft leasing companies have experienced relatively low fluctuation in their profitability and returns.
IATA regards the sharp decrease of lease rates in recent years, particularly for larger aircraft, the most influential reason for the lease popularity.18 They continue that while interest rates remain low, also the lease rates are attractive. IATA states that also delays of new Airbus and Boeing widebodies have contributed to growth of leasing as airlines are forced to enter into substitutive leasing agreements as a temporary solution. Indeed, the market have seen exceptional amount of sale and leasebacks. Those agreements benefit both airlines and lessors as former improves cash flow while the latter avoids pre-delivery payments and additional costs, states IATA. Also Finnair has entered into four financial leasing agreements, all of with the Airbus A330 aircraft.
CIT, corporate aircraft lessor, and Forbes carried out a survey of almost 136 airline executive around the world in 2010. In their survey over half of the respondents said that they lease more than 50% of their fleets.19 Interestingly, and on contrary, Finnair has announced that their strategy is to own more than a half of their fleet.20 The strategy is in line with the current
17 http://www.aviationfinance.aero/articles/11510/Leasing-can-provide-an-attractive-investment-opportunity-for- long-term-equity-investors%3A-Forsberg., retrieved 9.10.2012
18 http://www.iata.org/publications/airlines-international/august-2010/Pages/07a.aspx, retrieved 9.10.2012
19 http://catsr.ite.gmu.edu/SYST660/CIT_Aircraft_Leasing_Industry_Overview.pdf, retrieved 9.10.2012
20 http://www.finnairgroup.com/linked/en/downloads/Finnair_IR_November_2012.pdf, retrieved 4.3.2013
situation as Finnair owns 66% of their fleet. The fleet is covered more thoroughly in next sub- chapter.
A curiosity from the academic world is the study of Bazargan and Hartman (2012), where they develop a model for aircraft replacement strategy for both small low cost carrier with narrow fleet and major airline with diversified fleet. They find that regardless of the airline network size and fleet diversity the suggestion is same: prefer leasing over purchasing, prefer short-term leases, discourage fleet diversity and sell over 12 years old aircraft. This strongly speaks for behalf of leasing as a strong preference in today’s aviation world. This is in line with the findings of Oum et. al (2000) who consider leasing as an important tool for the modern airline industry
Despite the many optimistic predictions, the leasing market hasn’t come clear just yet, writes AirFinance Journal in August 2012.21 Lease rates are pretty unstable and quite low at the moment, clearly lower than before 2007. Paper suggests that this is due to a combination of low interest levels, depreciation of aircraft values and low profit margins. The cost of debt is rising and pushing rates up but at the same time lessor competition will hold rates down. Also recent quite large acquisitions among the largest lessors may have an impact. There is also a great variation in rates between the aircraft types. Michael Inglese, Chief Financial Officer at Aircastle, says that the rates for narrowbodies have held up well over the past year.
Widebodies struggle more but actually A330 seems to be returned to lease rate levels of 2007 due to high demand and lack of availability in the market. Especially in Asia, the demand for larger aircraft is indisputable.
Now, in the revival from the recent financial crisis, the world economy has rebounded and there has been a strong and rapid recovery among the aircraft lessors. More and more lessors are purchasing aircrafts from the manufacturers after a slower business cycle compared to airlines purchasing aircrafts directly themselves. In addition, the leasing market environment has changed during the crisis and several new players have entered the market. As conditions in the market continue to be uncertain, it may be that leasing companies emphasize increasingly creditworthy airlines in their customer selection. According to IATA, lessors are also looking to raise the security deposit and the maintenance reserve. Overall, leasing companies are generally reaching good profits, a trend that seems to continue. This increased role of the lessors emphasizes the highly topical question related to aircraft financing.
21 2012 OPERATING LEASE SURVEY. Airfinance Journal. Jul/Aug2012, p1-1., retrieved 1.10.2012
Increased importance of aircraft leases in airline business clearly states that the debate of buy versus lease is going to become more and more relevant. Next sub-chapter will present the case company, Finnair.
2.2 Presentation of the case company
This section presents briefly the case company. It will start by describing the outlook of the company today and tomorrow. It will also take a look back and review the results and major events in 2012. This is followed by a presentation of Finnair’s current fleet and how the aircraft financing is managed. Finally, the capital budgeting practices used are being discussed.
2.2.1 Finnair in 2013 – Strategy and outlook
Finnair is one of world's oldest continually operating airlines. The company was founded already in 1923 so Finnair will be celebrating its 90th anniversary in 2013. Finnair is for the most part state-owned. Although always being eager for long-haul expansion, Finnair was for a long time a basic point-to-point airline serving both domestic and European routes. Of course, in addition Finnair has for a long time had also broad long-haul coverage but not until past ten years the whole ideology is turned upside down and almost the whole fleet is actually harnessed to serve the Asian expansion. Now the role of the European flights are not just to bring Finnish people back home as it used to but to bring people from Europe to Helsinki and further to Asia and vice versa.
Indeed, in recent years, a key part of Finnair's strategy has been strengthening the company's position in the Asian market and particularly in traffic between Europe and Asia. Today, Finnair has been able to establish a solid position in traffic to Asia. This is heavily supported by the Finland’s favourable geographical location. The shortest great circle route from Europe to Asia passes through Helsinki. This brings a clear competitive advantage. Finnair is currently operating scheduled flights to 12 long-haul destinations: Tokyo, Osaka, Nagoya, Beijing, Chongqing, Shanghai, Hong Kong, Bangkok, Delhi, Seoul, Singapore and New York.22 In summer 2013 Finnair will also introduce nonstop flights to Xian and Hanoi. The dominance of Asian destinations is clear. Finnair reports that the Asian share of the total capacity is already 49.8% while contributing to 45% of total passenger revenue at the end of
22 http://www.finnairgroup.com/linked/en/konserni/Finnair_Financial_report_2012.pdf, retrieved 8.3.2013
year 2012. The weekly frequency of Asian flights is, depending on the season, about 70 flights. In Asia, Finnair is the 3rd largest carrier in its destinations and has an estimated market share of 5.9% on those routes.
Graph 14. Finnair’s passenger revenue split in Q3 2012. Source: Finnair.
About 20 million passengers travel annually on the Finnair’s Europe-Asia routes which makes this globally one of the fastest growing traffic areas. In addition, the traffic between Europe and China is forecasted to triple during the next 30 year as Airbus forecasts. Finnair’s core strategy is specifically based on this expected growth in Asia by providing the fastest connections between Europe and Asia, with high-quality service. Finnair strives to retain its reputation as one of the most punctual and safe airlines in the industry. Finnair will focus particularly in the fast growing Asian economies and to those European cities that do not provide direct connections to Asia. As Finnair states in its newest financial report, the growth of one percentage point in travel between Europe and Asia would mean approximately 200,000 potential new passengers annually. Airbus has forecasted that the expected annual growth would be 4.1% annually to 2031, measured by revenue passenger kilometres (CAGR).
To Finnair, this naturally means excellent opportunities for growth.
Figure 1. Finnair’s route structure in 2013. Source: Finnair.
Next, I will take a quick glance at year 2012 and review the key factors influencing where the company stands currently. 2012 Finnair finally returned to profit after four consecutive years of losses. Improved unit revenues and a successful cost-reduction program have definitely contributed to this. Finnair succeeded in increasing its turnover by 8.5% to 2,449.4 million euros while at the same time the profitability improved, resulting to an operational result of 44.9 million euros. In 2012 Finnair was one of the best companies in the industry in terms of unit revenue development. The renewed revenue management and pricing made an impact and Finnair over-performed its competitors in unit revenue growth during the first half of the year.23 Unit revenues of the full year improved by a record-breaking 7.7 percentages. This was achieved as both passenger load factor (PLF) and yield per revenue passenger kilometre (RPK yield) improved simultaneously.24
Being a traditional and long-serving airline has definitely both pros and cons. Of course the company culture is very strong and for example safety-orientation can be regarded as a self- evident truth. However, there are also downsides, one of which is the heavy cost structure.
23 http://www.finnairgroup.com/linked/en/downloads/04_CMD_Pete_031212_FINAL.pdf, retrieved 4.3.2013
24 http://www.finnairgroup.com/linked/en/downloads/05_CMD_Erno_031212_FINAL.pdf, retrieved 4.3.2013
Traditional airlines are built quite differently than for example low cost carriers. Also Finnair has been forced to restructure its businesses many times along the way as the environment constantly changes. In 2011 Finnair launched a structural change and cost-reduction program which aims to cumulated savings of 140 million euros by the end of 2013. By the end of 2012, already 100 million euros of permanent and annual savings were achieved. However, during 2012 Finnair introduced an additional cost-cutting program of 60 million euros to further improve the profitability and to ensure the future fleet investments. Finnair’s CEO Mika Vehviläinen states that additional cost reductions are absolutely necessary to achieve sustainable profitability needed to finance the Airbus A350 investments. Those investments are, needless to say, vital for Finnair to be competitive in the future.
One of the major events in 2012 related to restructuring were the transfer of European Embraer traffic to Flybe Finland Oy, a Finnish subsidiary of British Flybe and Finnair, with a contract flying-agreement. This means that the commercial control over the routes and the risk remain with Finnair. Flybe was already in charge of Finnair’s domestic flights. Other restructurings were related to technical services and catering.
Graph 15. Finnair’s debt ratios and cash flows. Source: Finnair.
Finnair has a strong financial position, which supports future investments. The company’s net cash flow from operating activities was 154.7 million euros in 2012, a clear improvement to last year's corresponding figure. The balance sheet also strengthened during 2012. The equity
ratio was 35.7%, gearing 17.6% and adjusted gearing 76.8%. At the end of the period under review, interest-bearing debt amounted to 569.0 million euros. Also the liquidity remained good in 2012. The company’s cash funds amounted to 430.5 million euros and in addition the company has the option for re-borrowing employment pension fund reserves worth approximately 430 million euros from its employment pension insurance company. Finnair also has funding available through an entirely unused 200 million Euro syndicated credit agreement, which will mature in June 2013. Finnair’s assets and liabilities are visualized in the graph below. More Finnair key figures can be found in APPENDICES
Appendix 1.
Graph 16. Finnair’s asset and liabilities. Source: Finnair.
Vehviläinen explains the Finnair’s vision and condenses it to three main points. First, Finnair is striving to double its revenue from Asian traffic by 2020 compared with the level of 2010.
Second, the company has set a goal to be the most desired option in traffic between Asia and Europe and among the third largest airlines on routes between Asia and Europe where passengers have to change planes. Third, Finnair also wants to be the number one airline in the Nordic countries and at the same time grow in this home market. 25
25 http://www.finnairgroup.com/linked/en/downloads/01_CMD_Mika_1_031212_FINAL.pdf, retrieved 4.3.2013
According to Vehviläinen, this is done by focusing on core airline business in both scheduled long and short haul traffic, in leisure traffic and in cargo traffic. Profitability needs to be improved by improving operational efficiency, cutting costs and changing cost structure and by increasing revenues. He concludes that Finnair’s strengths are a clear strategy, competitive advantage because of geographical location, modern, fuel-efficient fleet, high-class service, operational quality and efficiency, quality and capacity of Helsinki-Vantaa Airport and good financing position for implementing future fleet investments.
As Finnair states in one of its presentations26, the company needs to change along with the environment to remain competitive. This is recently done for example by optimizing the narrowbody fleet. Nine aircraft have been totally removed from service and several lease agreements have been renegotiated with multiple Airbus lessors. Also route planning and aircraft utilization have improved with the help of new network forecasting and fleet planning tools. In addition, new partnerships are improving cost efficiency and flexibility. For example Flybe Finland provides a lower cost base for turboprops and small jets.
As previously reviewed the outlook in Europe remains challenging and uncertain. The traffic is expected to grow in moderation and jet fuel prices will most probably remain high. This will set up a difficult environment but Finnair estimates that it will increase its turnover in 2013. The company also expects that unit cost excluding fuel will decrease and operational result will be in profit.
2.2.2 Current fleet and aircraft financing
Finnair has one of the most modern fleets in the world. The average age of the fleet is about ten years and long-haul fleet about seven years. The fleet consists of narrowbody aircraft which fly domestic and European scheduled and leisure flights and widebody aircraft purposed to long-haul routes. Finnair’s fleet is managed by Finnair Aircraft Finance Oy, a wholly-owned subsidiary of Finnair Plc. At the end of 2012, Finnair itself operated 45 aircraft, of which 15 are wide-body and 30 narrow-body aircraft. In addition to the aircraft operated by Finnair, its balance sheet includes 24 aircraft owned by the company and operated by other airlines, mainly by Flybe Finland. Finnair also has eight leased aircraft, which it has subleased and which are operated by other airlines. At the end of year 2012, two thirds of the fleet operated by Finnair was owned by the company while the remaining third
26 http://www.finnairgroup.com/linked/en/downloads/03_CMD_Greg_031212_FINAL.pdf, retrieved 4.3.2013
were leased. The main purpose of this diversification of ownership according to Finnair is the management of residual value risk of the aircraft.
Table 1. Finnair’s fleet on 31 Dec 2012.Source: Finnair.
The fleet operated by Finnair was reduced by an over-whelming twenty aircraft in total during 2012. Finnair transferred the traffic of its Embraer 190 aircraft to be operated by Flybe Finland Oy. This affected twelve aircraft. Additionally, the company received one ATR aircraft that is now leased to Flybe. Nine aircraft were additionally eliminated from the fleet when Finnair gave up four Airbus 32S series aircraft after the end of their leasing agreements and subleased four Embraer 170 aircraft to Estonian Air. Further, the company leased one Embraer 170 aircraft through a wet lease agreement to Honeywell for a year. It is noteworthy